See your solar report and savings in one minute.
Enter your postcode and Emily, our free AI solar adviser, shows you a personalised solar report right away.
Live solar assessment
Emily is our free AI solar adviser. Four steps. Real screens from the live tool.
Type your postcode
A postcode or full address is enough. Nothing else to fill in.
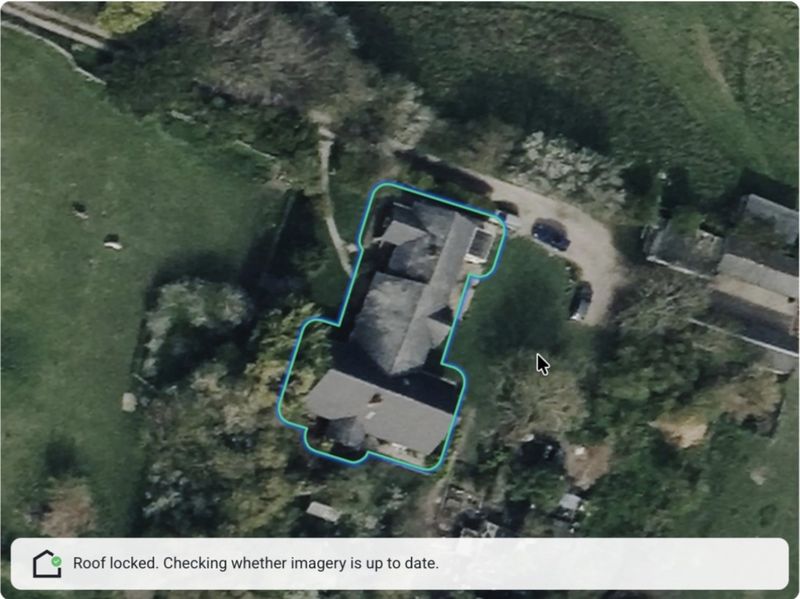
Postcode2026Or type your full addressFreeNo sign-upEmily locates your roof
Emily finds your house on the map and outlines the roof. Drag the map if she needs a hand.
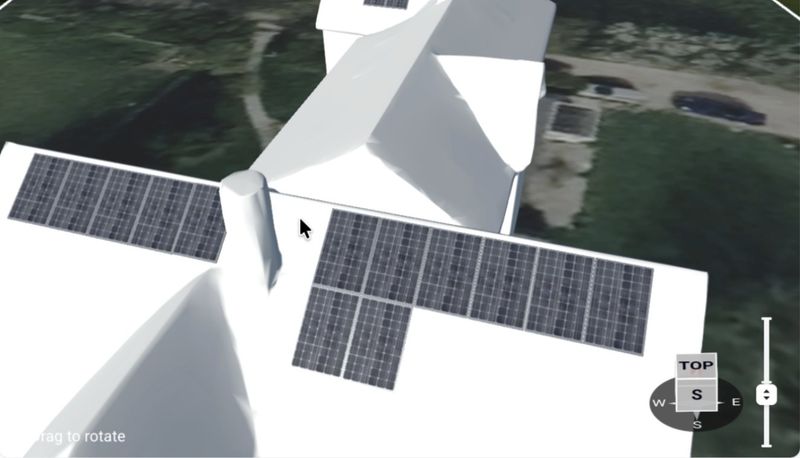
Watch Emily measure
Your roof is rebuilt in 3D. She checks size, sun and shade, then sizes the panels and battery.
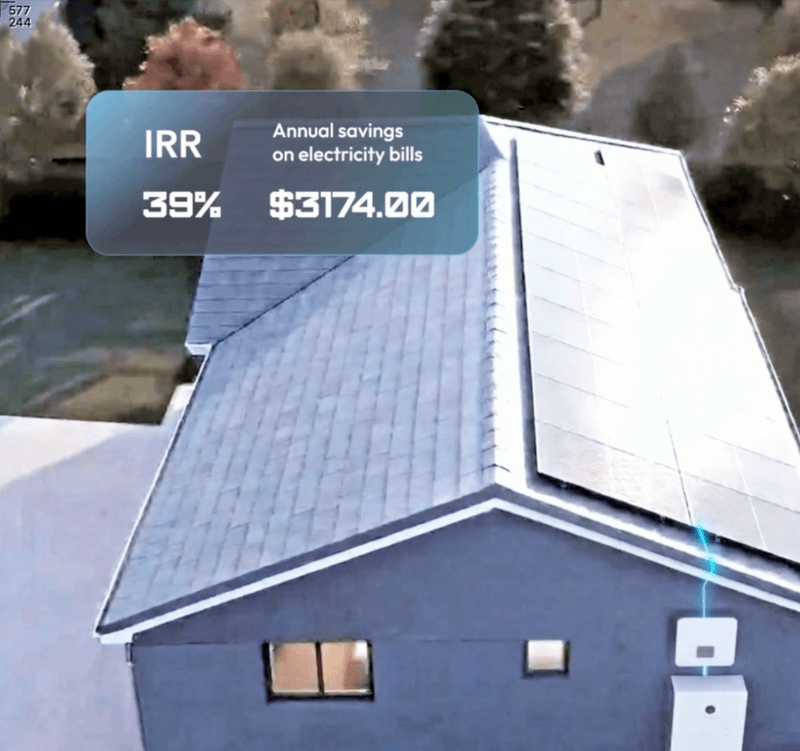
Review your options
Savings, payback and returns for three options, each as a range. No hidden extras.
What could your roof save you? Your solar savings.
Sunlight is free, but not equal. We modelled over 8.4 million rooftops one at a time to put a number on what each can save you each year. See your capital city, then get your own.

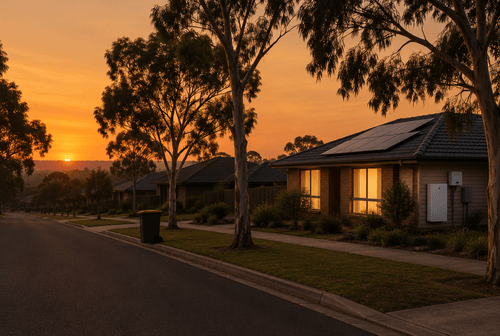
Same home. Bigger summer bill?
Long, bright days are when your roof earns the most, and when the aircon sends the bill up. Find out what solar could save you before the next one lands.
Get your solar report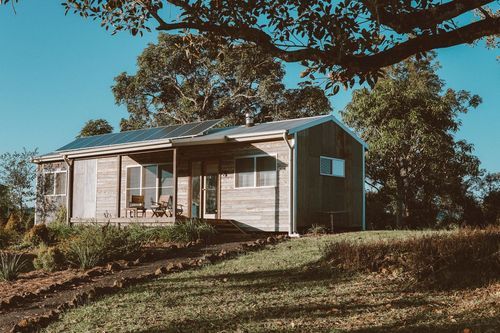
Battery or no battery? The straight answer.
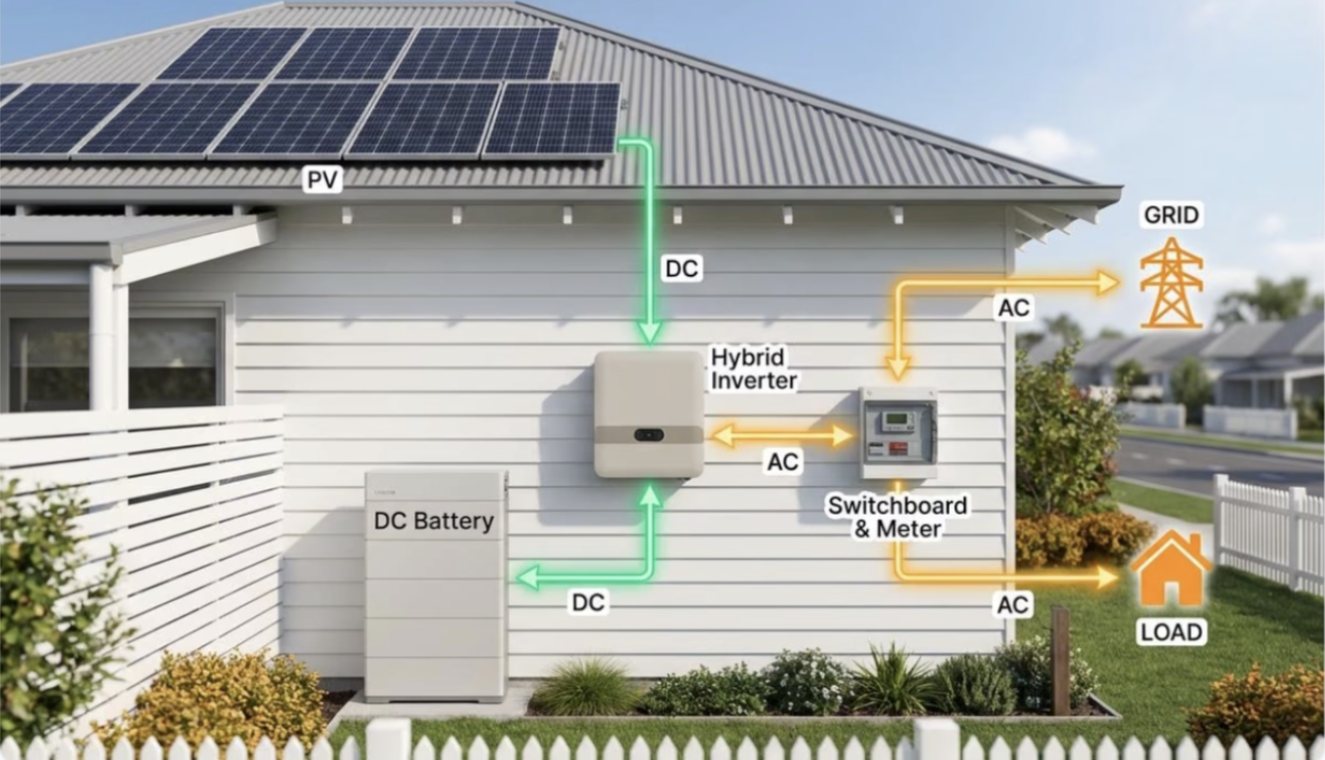
Panels feed a hybrid inverter. The battery stores what you don't use and gives it back at night. Emily shows the whole setup for your home.
What is your city already saving?
Pick your area and see what rooftops near you are saving. Then get your own roof's number.
Household savings and payback, by city and state
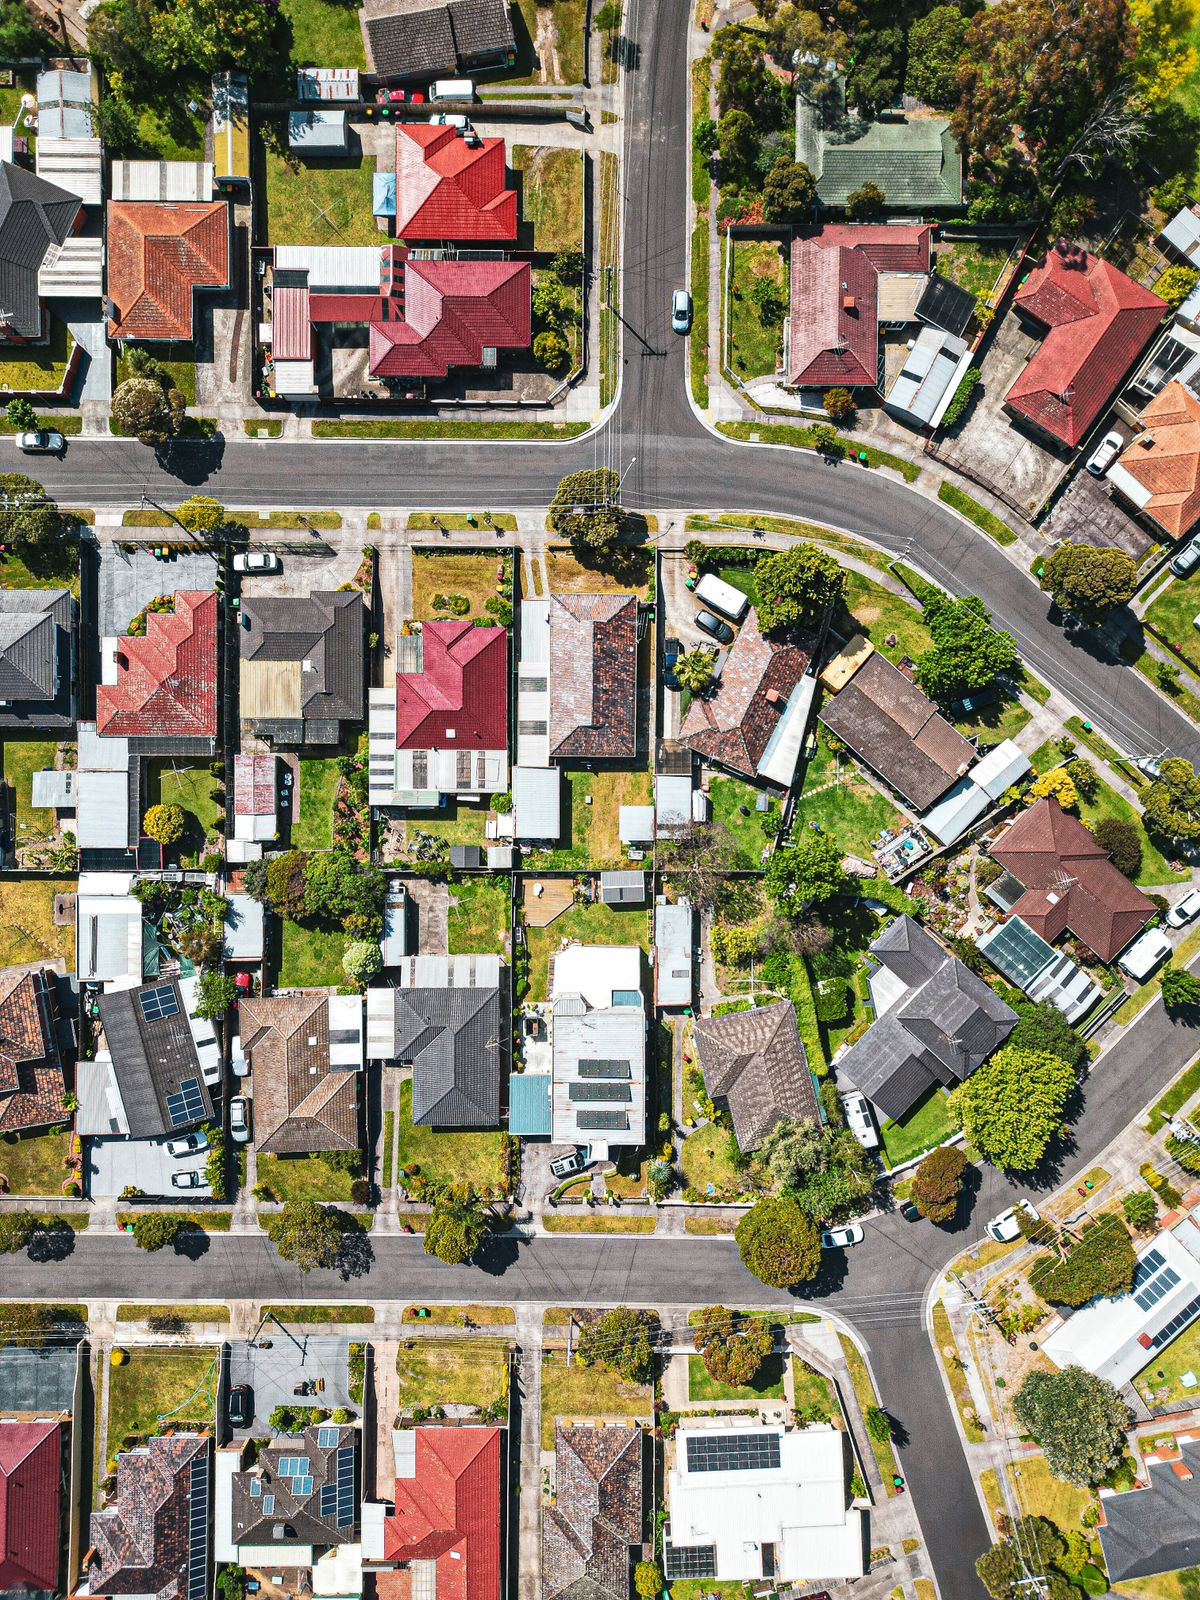
Real installs near you, shown by suburb.
Frequently asked questions
Panels run on daylight, not only direct sun. Even Hobart and Melbourne, the capitals with the least sun, model above $2,800 a year in average savings. How Australian weather affects solar output →
The average Australian home models $3,104 a year in bill savings with an optimised solar and battery system, across 8.4 million rooftops. Emily shows the number for your roof, not the average. What drives the saving, and where it is highest →
The modelled average payback is 4.05 years with a 24% return. What changes your result is your roof’s direction and shade, your power plan and how much you use during the day. Payback and returns explained →
It depends on system size, your roof and the rebates you qualify for. Emily prices three systems for your roof, so you see the cost and the saving side by side before any sales call. What affects the installed price in 2027 →
Most homes use only 25–40% of their solar without a battery. A battery lifts that to 60–90% and covers the evening, but it is not always the fastest payback. Emily shows both options for your roof. When a battery pays, and when it doesn’t →
Federal STC incentives apply to most new rooftop systems, and battery discounts and state schemes vary. Emily deducts the incentives that apply to your address from the upfront cost. Solar rebates in Australia →
Check accreditation, compare at least three quotes and read the warranties. Emily only introduces accredited installers who design with GreenSketch, and only when you ask. 10 checks before you sign →

Ready to see what your roof can do?
Not ready to buy? That's fine. Your report is yours to keep. An installer only gets your details if you choose to share them.
Get your free solar report